Photochemically Driven Solid Electrolyte Interphase For Extremely Fast-Charging Lithium-Ion Batteries
- 12 May 2024
- Volume 26
- NANOscientific Magazine, SPRING 2024
Minsung Baek1, Jinyoung Kim1, Jaegyu Jin2 & Jang Wook Choi1,3
1 School of Chemical and Biological Engineering and Institute of Chemical Processes, Seoul National University, Seoul, Republic of Korea. 2 Institute of Battery Technology, SK on, Daejeon, Republic of Korea. 3 Department of Materials Science and Engineering, Seoul National University, Seoul, Republic of Korea. jangwookchoi@snu.ac.kr
This article has been condensed from Nature Communications volume 12, Article number 6807 by NanoScientific under a Creative Commons Attribution 4.0 International License for the purpose of providing shorter and more accessible reading. For the full original article, please go to http://doi.org/10.1038/s41467-021-27095-w
ABSTRACT
Extremely fast charging (i.e. 80% of storage capacity within 15 min) is a pressing requirement for current lithium-ion battery technology and also affects the planning of charging infrastructure. Accelerating lithium ion transport through the solid-electrolyte interphase (SEI) is a major obstacle in boosting charging rate; in turn, limited kinetics at the SEI layer negatively affect the cycle life and battery safety as a result of lithium metal plating on the electrode surface. Here, we report a γ-ray-driven SEI layer that allows a battery cell to be charged to 80% capacity in 10.8 min as determined for a graphite fullcell with a capacity of 2.6 mAh cm−2. This exceptional charging performance is attributed to the lithium fluoride-rich SEI induced by salt-dominant decomposition via γ-ray irradiation. This study highlights the potential of non-electrochemical approaches to adjust the SEI composition toward fast charging and long-term stability, two parameters that are difficult to improve simultaneously in typical electrochemical processes owing to the trade-off relation.
INTRODUCTION
Lithium-ion batteries (LIBs) have revolutionized technology with significant impacts on electronics and electric vehicles, where the solid–electrolyte interphase (SEI) is crucial for battery performance, affecting lithium ion movement and overall battery longevity1,2,3,4,5,6,7,8.
Fast charging is essential for electric vehicle (EV) users, challenging due to the interfacial resistance at the anode, which affects battery safety and life by causing lithium metal plating; hence, enhancing SEI stability is vital7,9,10. SEI engineering, traditionally reliant on electrolyte additives, now explores γ-ray irradiation to refine SEI composition, providing a novel approach to control the SEI's inorganic and organic balance more precisely11,12,13,14,15,16,17,18.
Utilizing γ-ray-induced SEI layers on graphite anodes demonstrated a significant reduction in charging time to 10.8 minutes for 80% capacity, showcasing a promising method for achieving rapid charging without compromising battery durability.
RESULTS
Electrochemical vs. photochemical SEI
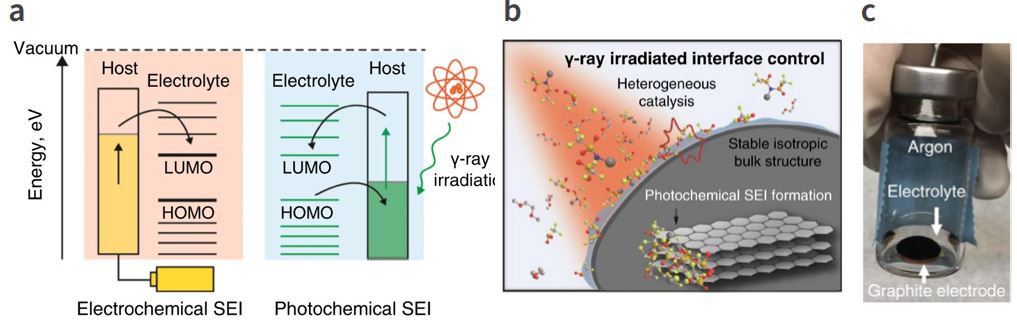
Electron transfer in electrochemical and photochemical solid-electrolyte interphase (SEI) formation is depicted in Fig. 1a, showing unidirectional electron movement from graphite to electrolytes in the electrochemical process, resulting in indiscriminate decomposition of electrolyte components. In contrast, γ-ray-driven photochemical reactions can selectively decompose compounds, especially fluorine (F)-containing salts, due to their propensity to form stable radicals, as illustrated in Fig. 1b, enhancing SEI tunability19,20,21,22. This process favors the formation of lithium fluoride (LiF), enhancing fast charging by forming an inorganic-rich SEI layer23,24.
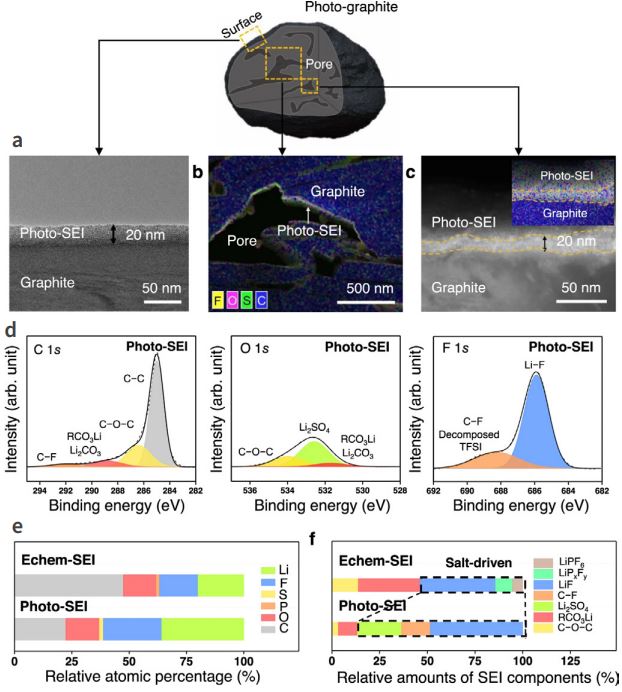
X-ray photoelectron spectroscopy (XPS) analysis compared the compositions of electrochemically and photochemically created SEI layers (echem-SEI and photo-SEI) using the same electrolyte, revealing distinct differences. The echem-SEI showed a mix of organic and inorganic components, while the photo-SEI, produced by irradiating a graphite electrode in electrolyte with γ-rays, was significantly richer in inorganic components, as evidenced by the presence of LiPF6 , LixPFy, and LiF peaks, demonstrating γ-rays' ability to create an inorganicrich SEI beyond what is achievable through conventional electrochemical methods.
γ-Ray-induced photochemical SEI
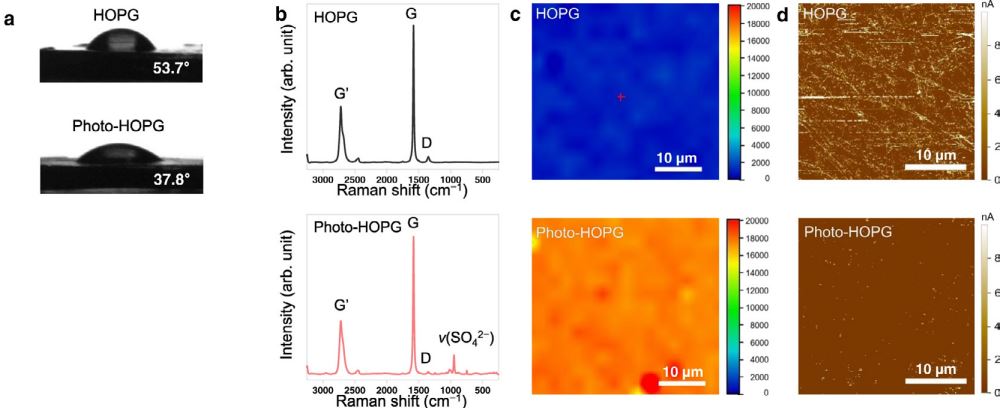
The photochemical SEI formation allows testing under varied electrolyte conditions without standard electrolyte constraints, as demonstrated by immersing graphite electrodes in electrolytes and exposing them to γ-rays (Fig. 1c). The selection of 1 M lithium bis(trifluoromethanesulfonyl)imide (LiTFSI) in EC/DEC (50/50 v/v) was based on its superior rate performance and LiF content compared to other salts. X-ray diffraction (XRD) confirmed the graphite structure remained unchanged postirradiation, indicating photolysis is interface-focused, supported by nuclear magnetic resonance (NMR) spectroscopy results. Transmission electron microscopy (TEM) and energy dispersive spectroscopy (EDS) mapping showed a uniform ~20 nm photoSEI layer on graphite, extending into particle pores, beneficial for fast Li-ion transport (Figs. 2a, b, c). Analysis on highly oriented pyrolytic graphite (HOPG) showed a distinct photoSEI composition with higher fluorine content compared to electrochemically formed SEI, highlighting the inorganic-rich nature of the photo-SEI layer (Fig. 2d, e, f).
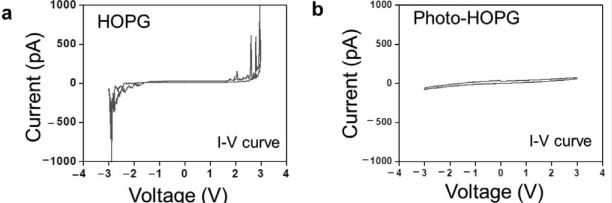
Surface analysis of photo-HOPG showed increased hydrophilicity and an inorganic-rich interface confirmed by Raman spectroscopy and atomic force microscopy (AFM), demonstrating uniform LiF-rich SEI coverage (Fig. 3a, b, c, d, and Supplementary Fig. 14). This uniformity, challenging with rigid inorganic crystals, underscores the potential of γ-rayinduced photochemical processes in SEI formation.
Electrochemical tests on the photo-graphite cell
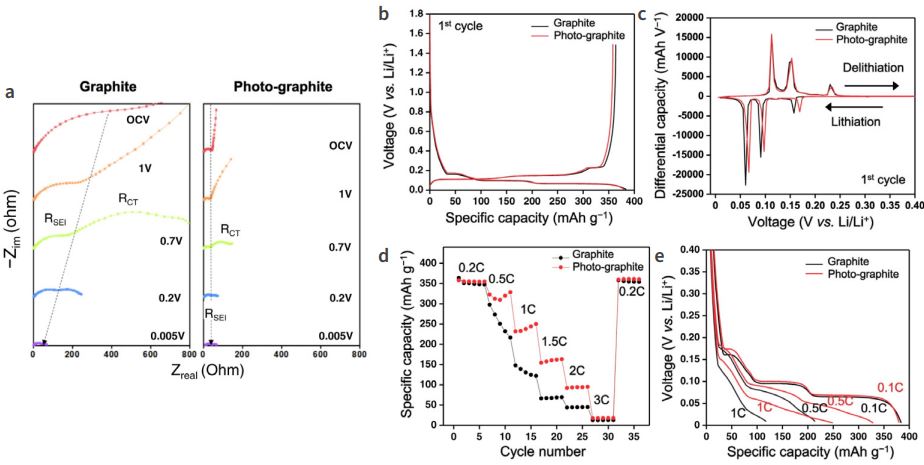
Electrochemical impedance spectroscopy showed that the photo-graphite cell's interfacial ionic resistance was significantly reduced after photochemical treatment, indicating a highly compact SEI layer and low resistance across lithiation potentials (Fig. 4a)[8][27]. Electrochemically, the photographite cell retained the graphite's main Li storage behavior with less polarization even at low rates (Fig. 4b, 4c)[28].
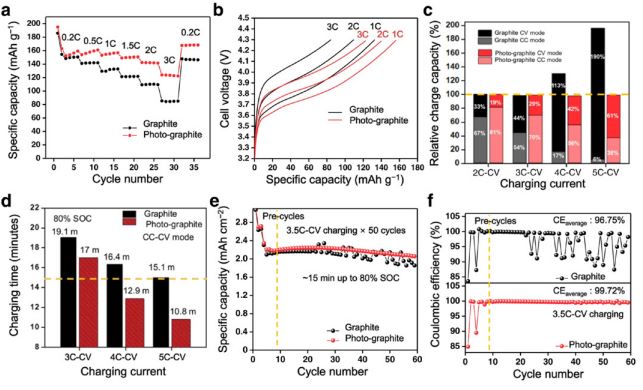
Specific capacity tests revealed that the photo-graphite cell outperformed the bare cell at higher C-rates, retaining more capacity and showing distinct lithiation profiles with lower overpotentials, indicative of superior charging capabilities (Fig. 4d, 4e)[29]. In full cells with a NCM622 cathode, the photographite showed enhanced charging performance and lower overpotentials (Fig. 5a, b). Under constant voltage, the photographite cell demonstrated robust cycling for 300 cycles and resisted overcharging at high C-rates, unlike the bare cell which showed Li metal plating and fluctuating capacities (Fig. 5c).
The photo-graphite cell required less time to reach 80% stateof-charge (SOC) at higher C-rates, underscoring its fast charging capability (Fig. 5d)[8]. Long-term cycling at fast charging conditions was stable for the photo-graphite cell, with a high Coulombic efficiency, contrasting with the bare cell's capacity fluctuations and CE destabilization (Fig. 5e, 5f).
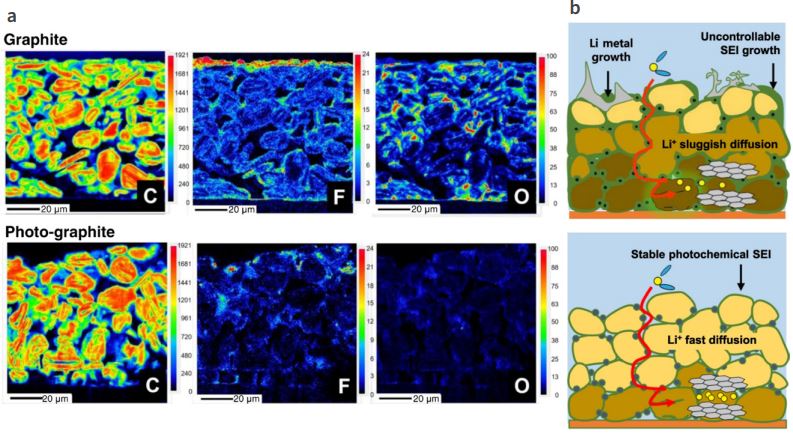
Microscopy showed the bare graphite electrode covered with Li plating after 100 cycles, while the photo-graphite electrode remained clean. The low interfacial resistance SEI enabled better low-temperature performance and higher temperature cycling for the photo-graphite. Post-mortem analysis showed a thicker SEI on the bare electrode, indicative of uncontrolled growth and Li plating, as opposed to the photo-graphite electrode (Fig. 6a).
SEI composition, particularly the inorganic-to-organic content ratio, is crucial for preventing SEI growth, Li metal plating, and ensuring fast charging with robust cycling (Fig. 6b). An inorganic-rich SEI is insulating and prevents electron transfer, maintaining a thin layer that supports fast charging operations without parasitic reactions or overcharging[34][35][36].
DISCUSSION
The main challenge in achieving extremely fast charging (XFC) for lithium-ion batteries has been speeding up lithium ion movement at the electrode interface without reducing battery life or safety. Traditionally, there's been little control over how the materials in the electrolyte break down, which affects the battery's performance. However, this study introduces a method using γ-ray irradiation to selectively break down fluoride-containing salts, leading to a lithium fluoride (LiF)-rich solid-electrolyte interphase (SEI) layer. This new inorganic-rich SEI layer enhances lithium ion diffusion and maintains stability, thus supporting a longer battery life and allowing the battery to charge up to 80% in just 10.8 minutes. Although γ-ray techniques might not be ready for immediate use in existing battery production, they offer valuable strategies for improving electrolytes and could influence further research on enhancing the stability of lithium-ion battery interfaces.
METHODS
Materials:
Mesocarbon microbeads (MCMB) graphite for anodes and NCM622 for cathodes were used as active materials. Highly oriented pyrolytic graphite (HOPG) was acquired from Alfa Aesar. Lithium salts LiTFSI and LiFSI were purchased from Sigma-Aldrich, USA, and solvent N-methyl-2-pyrrolidone (NMP) was obtained from JUNSEI, Japan. The conductive agent Super P came from Timcal, Switzerland. The electrolyte comprised 1 M LiPF6 in EC/DEC with 10 wt% FEC, sourced from Wellcos Corporation, South Korea. Binders used were SBR from Zeon and CMC from SigmaAldrich for graphite electrodes, and PVDF (Kynar) for NCM622 electrodes.
Physicochemical Characterization:
Atomic Force Microscopy (AFM) was conducted with the Park NX10 from Park Systems, South Korea, to map out the electronic conductivity by applying a voltage of 0.5 volts to the sample, at the RIAM of Seoul National University. XPS analysis utilized an AXIS-His spectrometer from KRATOS, U.K., and FE-SEM imaging was done using a JSM-7600F from JEOL, Japan. XRD patterns were captured with a Smart Lab from Rigaku, Japan, and cross-sections of photo-SEI were observed using a Cs-corrected TEM (JEM-ARM200F) from JEOL, Japan. Contact angles were measured with a DSA100 from Kruss, Germany, and Raman spectra were recorded using a RAMAN spectrometer II (DXR2xi) from Thermo Fisher, USA. LC–MS analysis was conducted with a Ultimate 3000 from Thermo Scientific, USA, using a Triple TOF 5600 from AB Sciex, USA. NMR used a 500 MHz AvanceIII-500 from Bruker, Germany, at NCIRF, Seoul National University, and FE-EPMA was performed on a JXA-8530F from JEOL, Japan.
Preparation of Electrodes:
For graphite electrodes, a slurry with graphite, Super P, and SBRCMC binders was spread onto copper foil and dried at 60 °C in a vacuum. Cathodes comprised a slurry of NCM622, Super P, and PVDF cast onto aluminum foil. Photo-graphite electrodes were prepared by immersing them in 1 M LiTFSI in EC/DEC and irradiating with γ-rays from an MDS Nordion irradiator at the Korea Atomic Energy Research Institute, then cleaned with DEC.
Electrochemical Characterization:
CR2032 coin cells were assembled for electrochemical testing, which involved pre-cycling and resting the cells with an electrolyte and separator from SK Innovation, South Korea. The cells were cycled using a battery cycler (WBCS 3000) from Wonatech, South Korea, and EIS measurements were taken with a potentiostat (VSP) from BioLogic, France. The rate capability and cycling performance at various temperatures were also evaluated, employing cells with precisely measured capacities.
DATA AVAILABILITY
The data that support the findings of this study are available from the corresponding author upon reasonable request.
REFERENCES
For the list of references, please go to https:// doi.org/10.1038/s41467-021-27095-w