Surface Properties-Performance Relationship Of Aluminum Foil As Negative Electrode For Rechargeable Aluminum Batteries
- 12 May 2024
- Volume 26
- NANOscientific Magazine, SPRING 2024
Noha Sabi,*[a, b] Krishnaveni Palanisamy,[c] Fatemehsadat Rahide,[a] Sven Daboss, [c] Christine Kranz,[c] and Sonia Dsoke*[a]
[a] Prof. Dr. N. Sabi, F. Rahide, Prof. Dr. S. Dsoke Institute for Applied Materials (IAM) Karlsruhe Institute of Technology (KIT), Germany noha.sabi@um6p.ma sonia.dsoke@kit.edu [b] Prof. Dr. N. Sabi High Throughput Multidisciplinary Research (HTMR) Mohammed VI Polytechnic University, Morocco [c] K. Palanisamy, Dr. S. Daboss, Prof. Dr. C. Kranz Institute of Analytical and Bioanalytical Chemistry Ulm University, Germany

This article has been condensed by NanoScientific under a Creative Commons Attribution 4.0 International License for the purpose of providing shorter and more accessible reading. For the full original article, please go to https:// doi.org/10.1002/batt.202300298
Abstract
Rechargeable aluminum batteries are gaining attention due to aluminum's abundance and stability. Understanding how initial surface properties of aluminum electrodes affect battery performance is crucial. We investigate the impact of aluminum foil surface properties on electrochemical behavior in half-cells. Different thicknesses (from 0.025 to 0.1 mm) of commercial aluminum foils with the same purity and hardness show varying microstructures and surface roughness, affecting cyclability. Atomic force microscopy (AFM) reveals corrosion of aluminum foil after cycling, leading to cell failure. The 0.075 mm thickness exhibits the best cycling stability.
Introduction
The rising demand for lithium-ion batteries (LIBs) has spurred interest in alternative energy storage systems utilizing more abundant resources. Rechargeable aluminum batteries (RABs), leveraging aluminum as the negative electrode material, offer promising theoretical capacity and sustainability. Unlike lithium and cobalt, aluminum is abundant and readily recyclable, making it an attractive option for future energy storage systems.
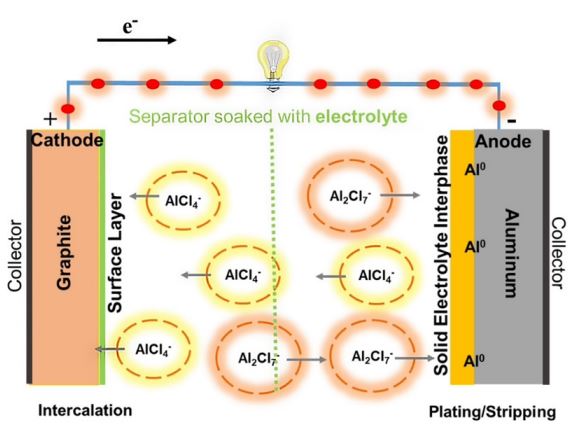
Aluminum boasts high gravimetric and volumetric capacities compared to other metals used in batteries, but it faces challenges with acidic ionic liquid-based electrolytes. Efficient plating and stripping depend on achieving a specific molar ratio between AlCl3 and the ionic liquid to enable crucial electrode processes.
Positive electrode materials in aluminum batteries employ intercalation or conversion mechanisms, with examples including vanadium oxide for intercalation and aluminum-sulfur batteries for conversion. Despite aluminum's favorable properties, issues such as self-consumption and foil degradation persist, necessitating the use of acidic electrolytes to enhance plating/stripping.
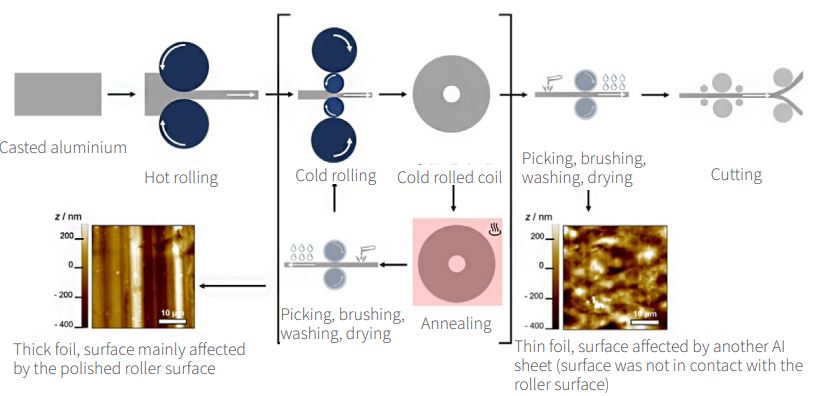
Surface properties of aluminum foils, including purity, thickness, and roughness, significantly impact electrochemical performance but are often overlooked. The production process influences surface morphology, with factors like rolling methods and cleaning techniques affecting grain composition and coating.
Through AFM, SEM, and XRD analyses, we examine aluminum foils with identical purity but varying thicknesses, correlating these properties with electrochemical performance. This study sheds light on the crucial role of foil stability during long-term cycling in AlCl3/EMImCl electrolyte under accelerated aging conditions.
Results and Discussion
Microstructural characterization of Al foils
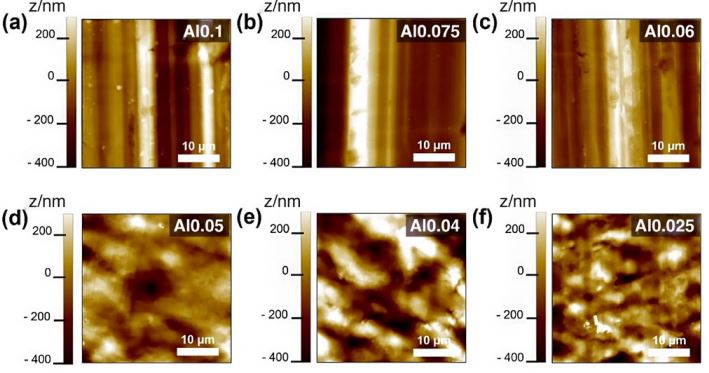
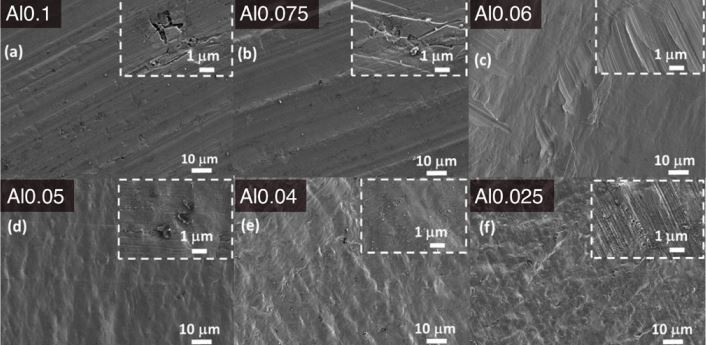
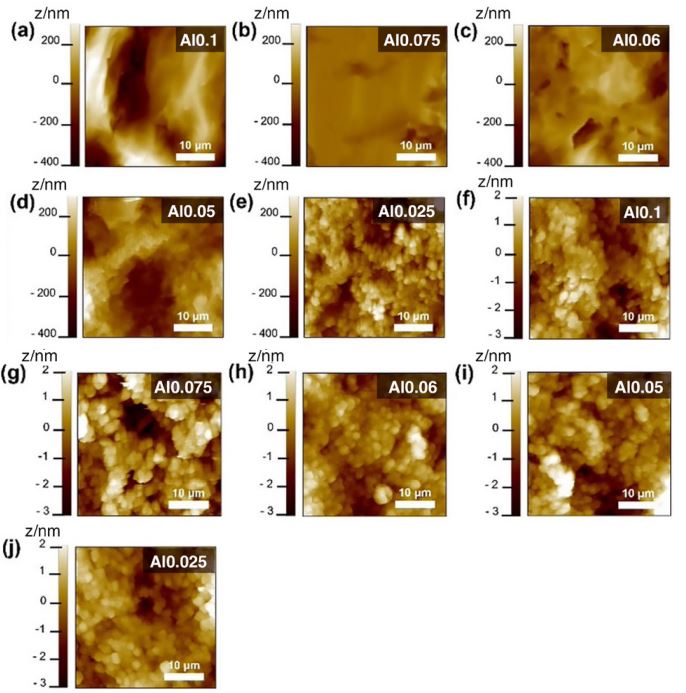
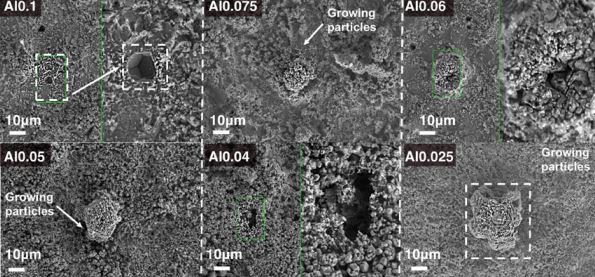
Microscopic techniques (AFM and SEM) were utilized to examine the surface finishing of pristine aluminum foils labeled as Alx (with x = 0.1, 0.075, 0.06, 0.05, 0.04, and 0.025, representing thickness in mm). AFM images (Fig. 1) were obtained from three distinct areas of each sample without prior surface cleaning or etching. SEM images in Fig. 2 display the microstructure of the pristine foils, revealing varied surface microstructures with rolling artifacts and grain boundaries observed in thicker foils (Al0.1 and Al0.075). In contrast, thinner foils (Al0.06, Al0.05, Al0.04, and Al0.025) exhibit less pronounced rolling artifacts and narrower spacing between stripes, consistent with AFM findings. XRD patterns confirm these observations, indicating variations in microstructure among the foils. These results underscore that foil structure and surface properties differ depending on the manufacturing process, irrespective of purity.
Electrochemical characterization via cyclic voltammetry
Electrochemical characterization via cyclic voltammetry reveals significant insights into the behavior of Al foils. Initially, minimal current densities are observed due to the presence of an Al2O3 layer, hindering ionic pathways. Plating/stripping current densities sharply increase from the 5th cycle, indicating passivation layer dissolution. A shift in oxidation peak intensity suggests foil corrosion and increased polarization over cycles. Plating/stripping capacities and coulombic efficiencies vary among foils, with Al0.075 demonstrating stable capacities and good efficiency. Cycling performances at a higher scan rate of 20 mV/s show sharp capacity increases until stabilization, with Al0.075 exhibiting the highest capacities. These variations suggest differing deposition morphologies and dendrite distributions, influencing the overall cycling performance.
Ex-situ characterization of the aluminum foils
Ex-situ characterization via AFM (Fig. 3) and XRD reveals significant insights into the behavior of aluminum foils after cyclic voltammetry. AFM analysis after 10 cycles shows altered morphology, with granular features in Al0.025 and Al0.05 and cracks in Al0.06 and Al0.1. Surprisingly, Al0.075 exhibits the least fractured microstructure. After 100 cycles, all samples show a granular microstructure due to Al deposition, with surface changes unrelated to thickness but influenced by surface roughness and microstructure. XRD patterns indicate a decrease in the intensity of the 111 reflection, particularly noticeable in Al0.025, corresponding to the formation of a new surface observed in AFM.
Accelerated aging by cycling at high temperature
Accelerated aging through high temperature cycling significantly impacts foil stability. SEM images after 100 cycles reveal foil dissolution and consumption (Fig. 4). Cyclic voltammetry at 60 °C and 80 °C initially shows higher current densities due to decreased electrolyte density and viscosity. However, foil degradation occurs rapidly, with Al0.025 failing after 12 cycles, and Al0.04 and Al0.05 deteriorating completely after 28 cycles. Plating/stripping capacities at 60 °C display low coulombic efficiency, improving slightly after 10 cycles but remaining unstable. Increasing to 80 °C enhances capacities but accelerates degradation, with foils lasting only a few cycles. The first cycle at elevated temperatures shows increased plating/stripping current densities, indicating accelerated stripping due to aluminum oxidation.
Effect of the electrolyte/electrode contact on the foils’ microstructure
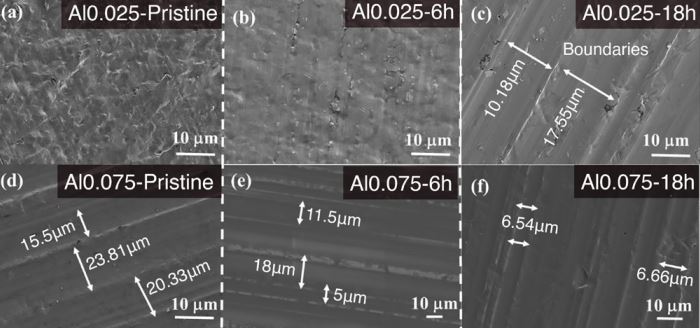
Two tests were conducted to determine the primary influence on the films' microstructure: immersing Al foils for durations equivalent to 10 (6 hours) and 100 (18 hours) cycles at 10 mV/s. AFM (Fig. 5) and SEM (Fig. 6) analyses showed minor changes in surface morphology for Al0.025 and decreased roughness for Al0.075 after immersion. XRD patterns revealed more significant changes in crystallographic orientations for Al0.025 compared to Al0.075 after immersion, suggesting greater sensitivity to electrolyte exposure. The results indicate that surface roughness increases during cycling due to corrosion and deposition, while static conditions lead to decreased roughness, possibly from native Al2O3 layer dissolution and new passivation layer formation. Foils with lower surface roughness perform better, while those with grain boundaries, like Al0.025, exhibit instability and microstructural changes, even with electrolyte contact.
Experimental Section
Materials and chemicals
-Electrolyte Preparation
The IL-based electrolyte was prepared in an argon-filled glovebox with controlled humidity. AlCl3 (anhydrous, Sigma Aldrich, 99.99%) was slowly added to EMImCl (Sigma Aldrich, ≥95%) at a molar ratio of 1.5/1 (AlCl3/EMImCl) while stirring at room temperature, resulting in a yellowish viscous liquid. Aluminum foils with various thicknesses (0.025 mm, 0.04 mm, 0.05 mm, 0.06 mm, 0.075 mm, and 0.1 mm) were obtained from Goodfellow (purity: 99%, temper: annealed). After 10 and 100 cycles, the cells were disassembled in the glovebox. The excess electrolyte was removed by rinsing each foil three times with acetonitrile (anhydrous, Sigma Aldrich, 99.8%), followed by vacuum drying for one hour to remove any residual acetonitrile.
-Characterization of the pristine and cycled Al foils
X-ray diffraction (XRD) analysis used a STOE STADI P diffractometer with Mo Kα1 radiation in rotating transmission mode. Aluminum foils were covered with kapton film under argon. Microstructural examination utilized a Zeiss Supra 55 Scanning Electron Microscope (SEM) with a 15 keV primary electron beam, where samples were mounted on a steel holder using carbon sticky tape.
AFM measurements on both pristine and cycled Al foils were conducted using an AFM microscope (Park NX10, Park Systems) within a glovebox under an Ar atmosphere (MBraun, O2, H2O < 0.1 ppm). Morphological changes and roughness were assessed before and after 10 and 100 cycles in AlCl3/EMImCl electrolyte, covering foil thicknesses from 0.025 to 0.1 mm. High aspect ratio silicon AFM probes (PPP-NCHR, NanoWorld AG) with a 330 kHz resonant frequency and 10 nm tip radius were utilized. Images were captured at 0.7 Hz scan speed. The force constant (k = 42 N/m) was determined via the thermal noise method. Roughness analysis (Sa, arithmetic roughness) employed an imaging processing tool (XEI 5.2, Park Systems) at three spots (30 μm×30 μm, n = 3). Statistical analysis included two-tailed nonparametric Mann-Whitney U tests with a significance level of p = 0.05. Results showed no statistically significant difference for 0.025 mm Al foils, while a significant difference was observed for 0.075 mm Al foils.

-Electrochemical measurements
Electrochemical tests were conducted using a Biologic potentiostat/galvanostat (Biologic VMP13) at temperatures of 25 °C, 60 °C, and 80 °C, covering a voltage range of 0.5–2.0 V (vs. Al) at scan rates of 10 mV/s or 20 mV/s. High scan rates were chosen to match the performance of Al/graphite systems to electrochemical supercapacitors in terms of power density. Cyclic voltammetry tests were performed using a TSC surface cell from rhd instruments (Germany) configured as a three-electrode airtight system.
Conclusions
This study investigated how surface properties of commercial aluminum foils, characterized using AFM and XRD, influence their electrochemical behavior in an AlCl3/EMImCl IL-based electrolyte. AFM measurements reveal different surface roughness of the as-received foils. Foils with higher surface roughness, such as Al0.025 and Al0.05, showed instability and rapid degradation during cycling, while Al0.075, with lower surface roughness and preferred crystal orientation (200), performed the best. These findings underscore the importance of considering surface roughness, crystal orientation, and foil thickness when selecting aluminum foils for stable electrochemical performance.